
Health
The Overlooked Biomarker: Why Your Triglyceride to HDL Ratio Matters More Than Total Cholesterol

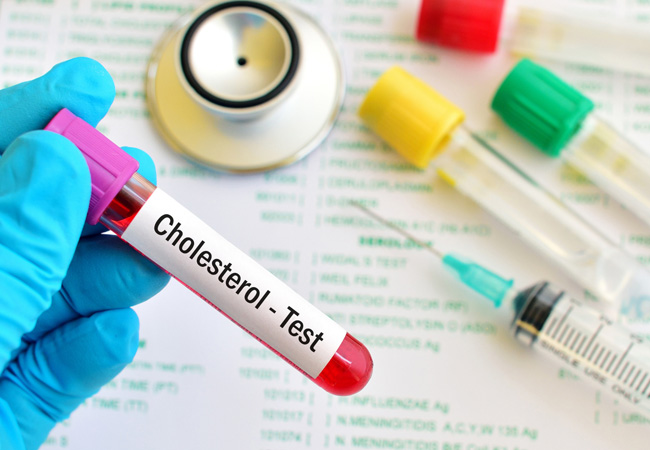
Every year, millions of Americans sit in an exam room, review their routine blood work with a physician, and fixate almost entirely on a single metric: LDL cholesterol. Decades of conventional cardiovascular messaging have conditioned both patients and practitioners to treat LDL-C as the supreme arbiter of heart health. If that number falls neatly within the standard reference range, people leave with a clean bill of health. If it creeps upward, anxiety follows, accompanied by urgent recommendations for low-fat diets or prescription statins.
Yet, a massive blind spot persists in standard cardiovascular assessments. A significant portion of individuals who suffer acute myocardial infarctions show completely normal, or even exceptionally low, total LDL cholesterol levels. At the same time, many people with elevated LDL live long, robust lives free from vascular disease.
The standard lipid panel contains a far more predictive, actionable, and revealing metric that rarely gets the attention it deserves: the triglyceride to HDL ratio.
This simple mathematical comparison requires no specialized testing, expensive advanced lipid panels, or genetic screening. It utilizes two numbers already printed on standard laboratory results. When interpreted together, triglycerides and high-density lipoprotein provide an exceptional window into your metabolic health, your liver function, and the true atherogenic potential of your bloodstream.
Decoding the Two Numbers on Your Lab Report
To understand why this ratio holds such predictive power, you must first understand what each component represents in human physiology. They are not merely arbitrary markers; they represent two opposing sides of your body’s lipid trafficking and energy storage systems.
Triglycerides: The Energy Spillover Marker
Triglycerides are the primary storage form of fat in the body. When you consume calories—especially rapidly digestible carbohydrates, liquid sugars, and alcohol—your body converts the energy it cannot immediately burn into triglycerides.
Your liver bundles these triglycerides into transport vehicles called very low-density lipoproteins (VLDL) and releases them into the bloodstream. From there, they travel to tissues for immediate fuel or to adipose tissue for long-term storage.
When your circulating triglyceride count is chronically elevated, it signals that your metabolic system is overflowing. The liver is producing more fat than peripheral tissues can absorb or clear, resulting in a continuous logjam of lipid-rich particles circulating through your vascular highway.
HDL: The Cellular Maintenance Crew
High-density lipoprotein has long been dubbed “good cholesterol,” though that label drastically oversimplifies its actual biological role. HDL particles do not act as static cholesterol units; they function as circulating metabolic vacuum cleaners and biochemical shields.
Through a process known as reverse cholesterol transport, HDL particles pick up excess, unneeded cholesterol from peripheral tissues and vascular walls, transporting it back to the liver for excretion or bile production. Beyond clearance, healthy HDL particles possess potent anti-inflammatory, antithrombotic, and antioxidant properties. They actively protect the fragile endothelial lining of your arteries from oxidative damage and prevent LDL particles from becoming toxic to arterial tissue.
The Interconnected Tug-of-War
Triglycerides and HDL do not exist in separate silos. They are intimately linked through a specialized regulatory enzyme called cholesteryl ester transfer protein (CETP).
When your blood is swimming with excess triglycerides, CETP initiates an exchange: it swaps triglycerides from VLDL into HDL particles, while simultaneously transferring cholesterol esters from HDL into VLDL. This process leaves your HDL particles dangerously overloaded with triglycerides.
Once engorged with fat, these altered HDL particles become structurally unstable. The liver and kidneys rapidly break them down and filter them out of circulation, causing your total HDL count to plummet. Therefore, a low HDL level is rarely an isolated genetic defect; it is almost always the direct downstream consequence of elevated circulating triglycerides.
The Hidden Truth About LDL Particle Size
The greatest failure of standard lipid panels is their inability to distinguish between different types of LDL particles. Standard testing measures LDL-C, which reflects the total mass or weight of cholesterol contained inside all LDL particles combined. It tells you nothing about the number of particles carrying that cholesterol, nor does it describe their physical characteristics.
In human blood, LDL particles generally fall into two distinct phenotypes:
-
Pattern A (Large, Buoyant LDL): These particles are fluffy, voluminous, and pliable. Because of their size, they struggle to penetrate the tight junctions of the endothelial wall. They circulate harmlessly, clear rapidly through normal hepatic receptors, and resist chemical oxidation.
-
Pattern B (Small, Dense LDL): These particles are compact, heavy, and structurally rigid. They easily slip beneath the endothelial lining of arterial walls, become trapped in the subendothelial matrix, and oxidize rapidly. Once oxidized, they trigger an aggressive immune response that leads directly to foam cell creation, arterial inflammation, and atherosclerotic plaque buildup.
A high triglyceride to HDL ratio serves as a reliable surrogate marker for the presence of dangerous, small, dense LDL particles.
When your triglycerides are low and your HDL is high, your body predominantly produces Pattern A particles. Even if your total LDL-C reads slightly elevated, those particles are largely harmless, buoyant carriers. Conversely, when your triglycerides are high and your HDL is suppressed, your bloodstream is dominated by Pattern B particles. You could have a seemingly “perfect” total LDL score of 100 mg/dL, yet carry a dangerously high concentration of atherogenic, small, dense particles actively embedding themselves into your arterial walls.
An Early Warning System for Insulin Resistance
Long before type 2 diabetes or clinical prediabetes appears on a standard metabolic panel, subtle metabolic decay takes root inside the body. The fundamental driver of this decline is insulin resistance.
When skeletal muscle and liver cells become desensitized to insulin, the pancreas compensates by pumping out increasingly massive quantities of the hormone to keep circulating blood glucose within normal bounds. For five, ten, or even fifteen years, a patient may show completely normal fasting blood sugar and a pristine hemoglobin A1c reading because the pancreas is working overtime to mask the problem.
However, the liver cannot hide this strain. Insulin resistance fundamentally disrupts hepatic lipid processing:
-
Fat cells, resistant to insulin’s storage signals, leak free fatty acids into the bloodstream.
-
These excess fatty acids flood the liver via the portal vein.
-
The liver converts these fatty acids into massive amounts of triglycerides via accelerated de novo lipogenesis.
-
The liver packages these lipids into an unending stream of VLDL, saturating the vascular tree and dragging HDL down with it.
Because hepatic lipid metabolism is exceptionally sensitive to early insulin signaling failures, your triglyceride to HDL ratio will begin to climb years—often more than a decade—before your fasting blood sugar ever breaches the prediabetic threshold. It is one of the most accessible early-warning systems available for detecting systemic hyperinsulinemia and visceral adiposity.
How to Calculate and Interpret Your Ratio
Calculating this metric requires basic arithmetic using your standard fasting lipid panel.
Divide your total Triglyceride number by your total HDL number (both measured in milligrams per deciliter, or mg/dL, standard in the United States).
For instance, if your laboratory report indicates a triglyceride level of 120 mg/dL and an HDL level of 60 mg/dL, you divide 120 by 60, resulting in a ratio of 2.0.
The Clinical Benchmarks
-
Ideal (1.0 or Below): A ratio close to 1:1 indicates superior insulin sensitivity, minimal vascular inflammation, and a lipid profile dominated by safe, buoyant Pattern A particles.
-
Favorable (1.0 to 1.9): This range reflects solid metabolic health and efficient lipid clearance, with low risk of significant small, dense LDL accumulation.
-
Borderline (2.0 to 2.9): Indicates emerging insulin resistance and an increasing concentration of atherogenic lipoproteins. Corrective dietary and lifestyle adjustments should begin here.
-
High Risk (3.0 and Above): A ratio exceeding 3.0 is a strong, validated indicator of established insulin resistance, high concentrations of small, dense LDL, and elevated cardiovascular risk, regardless of where your total cholesterol sits.
-
Severe (4.0 and Above): Reflects profound metabolic dysfunction, active hepatic steatosis (fatty liver), and systemic vascular inflammation that warrants immediate, comprehensive intervention.
Practical Strategies to Optimize Your Ratio
Because the triglyceride to HDL ratio is fundamentally driven by lifestyle and metabolic signaling rather than hardcoded genetics, it responds swiftly to targeted interventions. Most individuals can create dramatic improvements within eight to twelve weeks through strategic adjustments.
Eliminate Liquid Sugars and Refined Carbohydrates
Triglycerides are extraordinarily sensitive to dietary carbohydrates, particularly simple sugars. Fructose is especially damaging because it bypasses normal cellular energy checks and is metabolized almost exclusively by the liver, where it directly fuels triglyceride synthesis.
Eliminating sugar-sweetened beverages, commercial fruit juices, high-fructose corn syrup, and refined flour products removes the raw fuel feeding hepatic fat overproduction. Replacing these items with nutrient-dense, fiber-rich whole foods halts the continuous influx of excess glucose and allows the liver to clear existing stores.
Emphasize Whole, Anti-Inflammatory Fats
Replacing refined carbohydrates with healthy dietary fats produces a dual benefit: it lowers triglycerides by reducing carbohydrate-driven lipogenesis while providing the building blocks needed to support HDL production.
Focus on:
-
Monounsaturated fats: Extra virgin olive oil, whole avocados, and raw nuts support healthy lipid membranes and vascular elasticity.
-
Long-chain omega-3 fatty acids: Wild-caught cold-water fish such as salmon, sardines, and mackerel deliver high concentrations of EPA and DHA. Omega-3s actively suppress liver triglyceride synthesis and enhance the activity of lipoprotein lipase, the enzyme responsible for clearing fats from the bloodstream.
Build Muscle Through Resistance Training
Skeletal muscle is the primary metabolic engine of the human body, responsible for disposing of the vast majority of circulating glucose and fatty acids.
Engaging in regular strength training increases the expression of GLUT4 glucose transporters on muscle cell surfaces, allowing your body to clear energy from the blood without requiring massive spikes of insulin. As muscle tissue becomes more insulin-sensitive, the continuous hormonal signal driving liver triglyceride production finally turns off.
Incorporate Low-Intensity Aerobic Work
Low-intensity, steady-state aerobic conditioning—often referred to as Zone 2 exercise—specifically targets mitochondrial efficiency. During low-intensity sustained efforts, your muscle cells rely primarily on fatty acids for fuel rather than glucose.
Regular low-intensity movement trains your cellular machinery to burn through circulating triglycerides, improving fat clearance rates and steadily elevating HDL levels over time.
Moderate Alcohol and Guard Sleep Architecture
Alcohol is metabolized much like liquid fructose in the liver; it temporarily halts fat burning and shifts hepatic cells into overdrive producing triglycerides. For those struggling with stubborn ratios, even a temporary four-week pause in alcohol consumption can drop triglyceride levels significantly.
Similarly, chronic sleep deprivation spikes nighttime cortisol and adrenaline, triggering morning glucose spikes and acute insulin resistance. Ensuring seven to eight hours of sound, uninterrupted sleep stabilizes autonomic nervous system signaling, supporting healthy lipid clearance around the clock.
The next time you review your routine blood work, look past the generic cholesterol brackets. Calculate your triglyceride to HDL ratio, track its trajectory over time, and use it as an honest, real-time assessment of your internal metabolic engine.